
F1 Data Analysis - Positions Gained/Lost in a Season


Welcome back to our series on Formula 1 data analytics! Today, we're delving into another intriguing (or boring to some) aspect of racing statistics, calculating the total positions gained or lost by each driver throughout a season. We'll be using the FastF1 Python library and Pandas for our analysis. This is a great way to see which drivers have been making impressive moves on the track throughout the year. Let's dive in and explore the data!
If you are new to FastF1 or Python in general, please check out my introductory post here.
 F1Monkey
Some Caveats
There are a couple of nuances we need to consider, especially when it comes to understanding the starting positions of drivers.
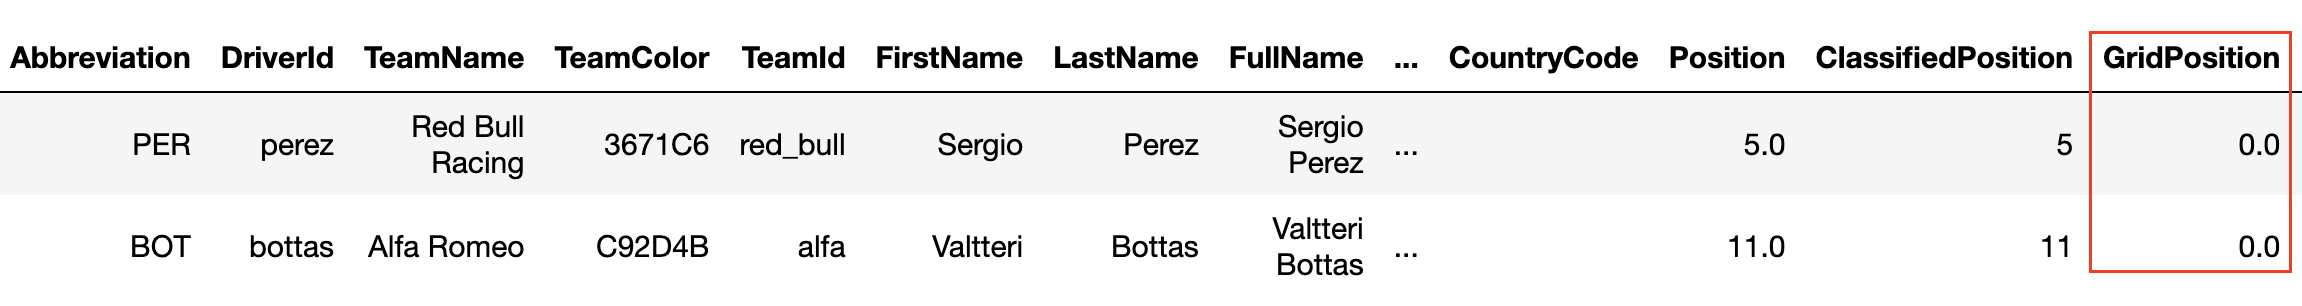
Firstly, in situations where drivers begin the race from the pit lane, the FastF1 library records their GridPosition as '0.0'. This scenario was evident in the 2023 Australian Grand Prix, where both Bottas and Perez started from the pit lane. The challenge here is that FastF1 does not specify who is 19th or 20th in such cases. To accurately determine their starting positions, we need to refer back to their qualifying results. In our example, Bottas qualified 19th and Perez 20th, which effectively placed them 19th and 20th on the starting grid.
Another point to consider is when a driver does not participate in a race. For instance, Stroll did not compete in the 2023 Singapore Grand Prix, leaving only 19 drivers in the race. In such cases, if two or more drivers start from the pit lane (reported as GridPosition '0.0' by FastF1), their starting grid positions need to be calculated based on a total of 19 drivers, not 20. If a driver withdraw from a race, the 'Status' will be marked as 'Withdrew' and the 'ClassifiedPosition' will be marked as 'W'

Please note that is analysis excludes Sprint Races
The Script
import fastf1
import logging
from tabulate import tabulate

logging.getLogger('fastf1').setLevel(logging.CRITICAL)
fastf1.Cache.enable_cache('cache_dir')

year = 2023
driver_positions = {}
schedule = fastf1.get_event_schedule(year)
for index, row in schedule.iterrows():
    if 'Pre-Season' in row['EventName']:
        pass
    else:
        track = row['Location']
        session = fastf1.get_session(2023, track, 'R')
        session.load()
        df = session.results

        count = len(df[~((df["Status"] == "Withdrew") & (df['ClassifiedPosition'] == 'W'))])

        # Find drivers with grid position 0.0
        drivers = df[df['GridPosition'] == 0.0]['Abbreviation']
        if not drivers.empty:
            # Get qualifying session and load results
            q = fastf1.get_session(year, track, 'Q')
            q.load()
            q_df = q.results

            # Filter and sort qualifying results of penalized drivers
            filtered_df = q_df[q_df['Abbreviation'].isin(drivers.tolist())]
            filtered_df = filtered_df.sort_values(by='Position', ascending=False)

            # Assign new grid positions
            counter = 0
            for row in filtered_df.itertuples():
                new_grid_pos = count + counter
                df.loc[df['Abbreviation'] == row.Abbreviation, 'GridPosition'] = new_grid_pos
                counter -= 1

        for driver in df['FullName']:
            grid = int(df[df['FullName'] == driver]['GridPosition'].iloc[0])
            try:
                finished = int(df[df['FullName'] == driver]['ClassifiedPosition'].iloc[0])
                positions_gained = -(finished - grid)
                if driver not in driver_positions:
                    driver_positions[driver] = []
                driver_positions[driver].append(positions_gained)
            except:
                pass

for k,v in driver_positions.items():
    driver_positions[k] = sum(v)

# Convert dictionary to a list of tuples and sort it
driver_positions_list = sorted(driver_positions.items(), key=lambda x: x[1], reverse=True)

# Print using tabulate
print(tabulate(driver_positions_list, headers=['Driver', 'Positions Gained/Lost']))- Initial Setup and Empty Dictionary Creation
- The script starts with setting up the FastF1 library and disabling verbose logging for cleaner output.
- An empty dictionary
dictis created to keep track of the positions gained or lost by each driver in each race.
- Retrieving the Race Schedule
- The script fetches the event schedule for the year 2023 using FastF1's
get_event_schedulefunction. - It then iterates through each event in the schedule.
- The script fetches the event schedule for the year 2023 using FastF1's
- Processing Each Race:
- For each race (excluding pre-season events), the script loads the race session data.
- It filters out drivers who 'Withdrew' and were classified as 'W' in the race results, as they don't count towards the calculation of positions gained or lost.
- Handling Grid Penalties and Pit Lane Starts (Addressing Caveats)
- The script identifies drivers who started from the pit lane (indicated by a GridPosition of 0.0) and then fetches their qualifying session results.
- It sorts these drivers based on their qualifying performance to assign them appropriate starting positions at the end of the grid. This step is crucial to accurately reflect their actual starting positions, considering the grid penalties.
- Calculating Positions Gained or Lost
- For each driver in a race, the script calculates the difference between their starting position (GridPosition) and their finishing position (ClassifiedPosition).
- This difference indicates the number of positions a driver gained or lost during the race.
- Aggregating Results Across the Season
- The positions gained or lost by each driver in each race are accumulated in the dictionary
dict. Each driver's abbreviation/short-name serves as a key, and the values are lists of positions gained or lost in each race. - After processing all races, the script sums up these values for each driver to get the total positions gained or lost throughout the season.
- The positions gained or lost by each driver in each race are accumulated in the dictionary
Finally, script prints out the dictionary after sorting as a nicely formatted table that shows the total number of positions each driver gained or lost over the course of the season.
Driver              Positions Gained/Lost
----------------  -----------------------
Sergio Perez                          104
Lance Stroll                           58
Max Verstappen                         42
Guanyu Zhou                            39
Logan Sargeant                         32
Esteban Ocon                           31
Lewis Hamilton                         30
Yuki Tsunoda                           27
Pierre Gasly                           15
Alexander Albon                        12
Nyck De Vries                           9
Fernando Alonso                         8
Liam Lawson                             8
Daniel Ricciardo                        7
Lando Norris                            4
Charles Leclerc                         4
George Russell                          2
Valtteri Bottas                         1
Kevin Magnussen                         0
Oscar Piastri                          -4
Carlos Sainz                          -15
Nico Hulkenberg                       -37
Please note that the final result for each driver is calculated as the net positions gained or lost throughout the season. For example, if a driver gained 15 positions in total but lost 5 at different times, their net gain is 10 positions. On the other hand, if a driver loses more positions than they gain, their result will be a negative number, showing a net loss.


